Common Operations
From dmon
DMON is a software tool designed to enable SOC (system-on-chip) software applications to be debugged. It connects to the target over a dedicated communications link and issues commands to a debug support unit on the target which provides the necessary functions to debug the application. The DSU (debug support unit) allows reads and writes over the AHB on-chip bus. The debug interface supports LEON2, LEON3 or LEON4 debugging. Debug interfaces act as AHB masters providing their debug functions implemented in hardware. Thus no software support is necessary on the target.
Target initialisation[edit | edit source]
By default DMON will identify the target SoC by attempting to read the AHB plug and play area on the chip. DMON also supports specifying the devices on the chip using a configuration file, and has a number of built in SoC configurations. If the plug and play area cannot be read DMON will default to the Leon2 mode configuration which has a subset of known devices which are common to most Leon2 SoC.
Where the target does not support Plug&Play (PnP) DMON can accept command line options -brd [ID] to identify the board or the –leon2 switch to default to a minimum set of LEON2 devices. A configuration file can also be specified using the –cfg option. See Command Reference section for more detail.
Once the configuration has been established, DMON will probe the memory controlled by the SoC. This step can be bypassed by passing the –ni option. If a DDR controller is present DDR memory will still be probed unless the –niddr option is passed. Certain CPU and other registers will also be initialised.
Application Program debugging[edit | edit source]
DMON allows an application program to be debugged, either using GDB or directly. Break and watchpoints can be set using the hardware provided by the CPU or using a software breakpoint – where a memory location is replaced with a special instruction which triggers processor halt when that instruction is executed. It is also possible to single step through the program an instruction at a time, or for a number of instructions. Code in memory can be disassembled. If an ELF file has been loaded, or the symbols for an ELF file are loaded, these symbols can be used to set breakpoints and to display disassembled code showing the symbols instead of the raw addresses.
Loading an application to the target[edit | edit source]
The load command can be used to load LEON software applications to the target system memory prior to execution.
The load command supports ELF32-SPARC, SRECORD and binary files for application code. Code and data sections are uploaded to their relevant addresses and the entry point address is used to load the program counter when started with the run command. Symbols are extracted from an ELF file and can be used as parameters for various commands – they are also used when displaying information about breakpoints etc. If a stripped ELF file was loaded (with no symbol information) symbols can be loaded later using the symbols command.
Since binary files contain no section information the data will be loaded to the specified start address. If no start address is specified it will be loaded to the start of the SRAM address area controlled by the memory controller.
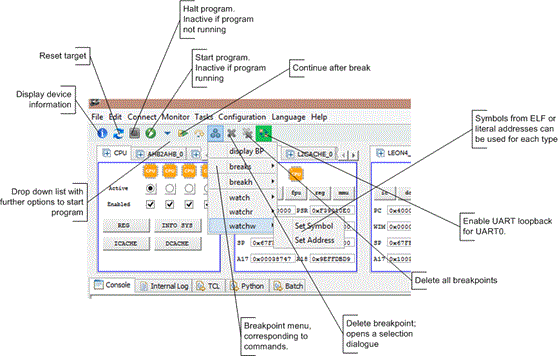
Files can be selected using the file selection dialog from the menu – this is also available if the GUI is not. The file selected will be inserted in the correct position on the command line.
load [file] Load file. The file path may either be absolute or relative to the DMON working directory, see “cwd” command. The file type is detected by examining the first few bytes – if these match the ELF identifier, then it is assumed to be an ELF file; If they match an SREC then it is an SREC file, otherwise it is treated as binary data.
load bin [file] Load a file, force it to be treated as binary.
load [address] [file] Load a file to address, if it is a binary file. For ELF or SREC, the address parameter will be ignored.
load bin [address] [file] Load a file to address, force it to be treated as binary.
check [file] Verify that the file corresponds to the contents of memory. The file type is detected by examining the first few bytes – if these match the ELF identifier, then it is assumed to be an ELF file; If they match an SREC then it is an SREC file, otherwise it is treated as binary data. Binary data will be searched for at the start of RAM.
check [address] [file] Verify that the file corresponds to the contents of memory starting at address, if it is a binary file. For ELF or SREC, the address parameter will be ignored. ep [value] <cpu#> When the run or go command is executed, DMON initialises the PC and NPC of each CPU core before starting the processor. By default this is with the entry point from the latest ELF file loaded. The “ep” command allows changing that value. By default the active CPU (see cpu command) will be modified, but a specific CPU can be specified.
symbols <file> show/load symbols from ELF file
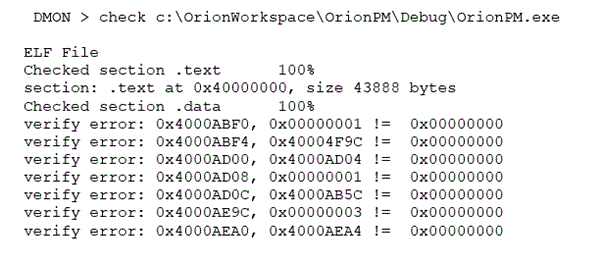
The check command can be used to verify that that program has been uploaded correctly. Differences will be shown as seen below:
Note that differences in the data section are to be expected if the program was run. Unless the program modifies its own source code there should be no difference in the text section.
Running an application[edit | edit source]
After loading an application the run command is used to start execution of the program, after initialising the target. If the go is used execution is started at the specified address, but without initialising the target.
The stack pointer is normally initialised by DMON to the top of RAM found during the memory probe. The same value is applied to all CPU. This can be modified using the stack command; it is important to modify it if more than one core is running and stack management is not handled by the application software itself.
run <addr> start execution at entry point or address
go <addr> start execution without initialization
halt stop program on board
step <n> single step one or [n] times
continue continue execution after program was halted by user or debug unit
stack <value> <cpu#> display stack pointer or change initial value for cpu/cpuall. Changes active cpu if none is specified.
profile enable enable collection of profile data, periodically sampling the PC
profile Display profile information collected previously
profile disable Disable collection of profile data.
Setting break and watch points[edit | edit source]
breaks and breakh are used to add instruction breakpoints. The breaks command adds a software breakpoint by inserting the (ta 1) trap instruction at the specified address. The breakh command uses the IU watchpoint registers for detection of the breakpoint thus eliminating the need to modify an application instruction by inserting a trap instruction. Where the code is executing from read-only memory only hardware breakpoints can be used.
The watch, watchr and watchw command can be used to detect access, read and write to memory. DMON allows the Hardware break/watchpoint registers in the Integer Unit of the CPU to be used to stop the processor when the specified address is read, written or fetched for execution. There are usually two such registers per CPU, DMON detects how many are actually implemented.
If the hardware registers are being used, DMON will combine commands which apply to the same address to use the same register – for example breakh address followed by watchr address will stop the processor when either the instruction is fetched for execution or the address is read. Only one set of registers will be used.
Note: When using symbols to set breakpoints, the address assigned to the breakpoint is that of the word after the value of the symbol: this is to ensure that the instruction at symbol has been executed when the breakpoint is detected. This is also consistent with typical GDB behaviour.
Commands accept a cpu argument – cpuN where N ins in the range 0 to number of cpus - 1 or cpuall if the command is to be applied to all CPU. By default commands will apply to the active cpu – see cpu command. The CPU argument is ignored for Software breakpoints, since these affect memory not CPU registers.
With no arguments the commands to set breakpoints simply list the breakpoints set:
breakh <addr|symbol> <cpu> display breakpoints or add hardware breakpoint
breaks <addr|symbol> <cpu> display or add software breakpoint
clear delete all breakpoints
clear [cpu] delete all breakpoints on a cpu. SW breakpoints are associated with CPU0 for the purposes of this command
clear [addr|symbol|number] <cpu> clear a breakpoint, specified by number from the list displayed, or by the address, or by the symbol. Software breakpoints will always be cleared with this command. HW break and watch points will only be cleared on the active CPU or the specified CPU
watch <addr|symbol> <cpu> display all breakpoint or add data watchpoint on read or write
watchr <addr|symbol> <cpu> display all breakpoint or add data watchpoint on read
watchw <addr|symbol> <cpu> display all breakpoint or add data watchpoint on write
The CPU command[edit | edit source]
In a multi-processor system, DMON needs to select a CPU to which some commands are applied. This is the “active” CPU. The DSU also allows a CPU to be disabled – this means that SW running on the target cannot use that CPU.
The cpu command allows these features to be controlled. They are also displayed and can be controlled from the GUI.
cpu Displays which cpu is active and whether the cpu are enabled. Example output:
DMON > cpu
cpu 0: enabled active
cpu 1: enabled
cpu 2: disabled
cpu 3: enabled
cpu active n Select cpu n as the active CPU. By degfault commands which apply to a single cpu are applied to CPU 0. n must be in the range 0 to “number of cpu – 1”
cpu enable n Enable the cpu n for use. After reset typically all CPU are enabled.
cpu disable n Disable cpu n
GUI Features[edit | edit source]
Hardware breakpoints and watchpoints set through the GUI apply to the active CPU, see the cpu command.

